
HEADS Site software from TechSOFT Engineering Services is facility for various infrastructure development projects by processing Topographical and Spatial Survey Data effectively for most economic Site Leveling and Grading which is the primary job for Land Development, that is used for platforms for the construction of Housing Projects, Industrial Plant Projects. HEADS Site also features for Water Resources Developments and Management, Drainage, Roads, Airports, Mining, Land record data and Land Plan drawing in MS-Access Database system, Water Distribution System etc.

Cloud based Process / Storage / Sharing facilities are available as optional. On procuring multiple licenses, say, four licenses, and installing at four different locations anywhere in the country/world, the project name, user name and password may be shared with those four license locations. They all can access cloud server to view the design and drawings, modify, re-process, download, upload the work at the cloud storage 'Techsoft Drive'.
Website: www.techsoftglobal.com
Email: techsoftinfra@gmail.com, techsoft@consultant.com
Tel: +91 9331 9330 39, +91 33 4008 3349, +91 33 4603 6129
Page 1 off 32


Page 2 off 32
We are pleased to introduce to software HEADS Site for Infrastructure Construction Project applications featuring processing of Survey data, Land Record Management and Site Development. The detail Technical Specification is described in following sections for your reference.
HEADS Site Release 24 is a CAD based software and has full range of applications Survey applications. It handles various Survey data, DTM, Triangulation, Contour, Satellite images, Conversion from TM (Survey) to UTM (GPS) Coordinates, Communication with Google Earth to plan for Bypass and Green Field Bypass Alignments, Use of Ground elevation data by Online downloading from Shuttle Radar Topography Mission (SRTM) from Internet without any Field Topo Survey, Alignment Geometric design for Road / Canal / Bund / Dyke Traversing with closing error corrections by Bowditch, Transit, Closed Link, EDM, Ground Sections in CAD Drawings.
HEADS Sites: General Technological Applications and Specific Project Applications
Planning and Design of various infrastructure projects needs effective software system to create and modify the design as desired to finally produce the best deliverables for the construction of the projects. HEADS Site is the most effective tool for such needs as one stop solution with latest satellite technology applications.
Survey Applications
Land Record Management
Site Leveling and Grading
Irrigation Applications
Earth Dam or Dyke Design
Concrete Gravity Dam Design
Page 3 off 32
Canal Design
River and Canal De-Siltation by Dredging
Measurement of Stockpile Quantity
Water Discharge Quantity by Measuring Water Level
Analysis for Stability of Slopes
Mining Applications
Stockpile Quantity Measurement
Open Cast Excavation Measurement
Design of Road/Highway Project
Design of Tunnel Project
Design of Airport Project
Design Runway or Taxiway
Page 4 off 32
Airfield Pavement Design
Airport Planning
Design of Water Distribution Pipe Network
Tutorials are provided along with the software on following applications
Survey Applications
Irrigation Applications
Mining Applications
Infrastructure Application
Page 5 off 32
HEADS SITE SURVEY APPLICATIONS
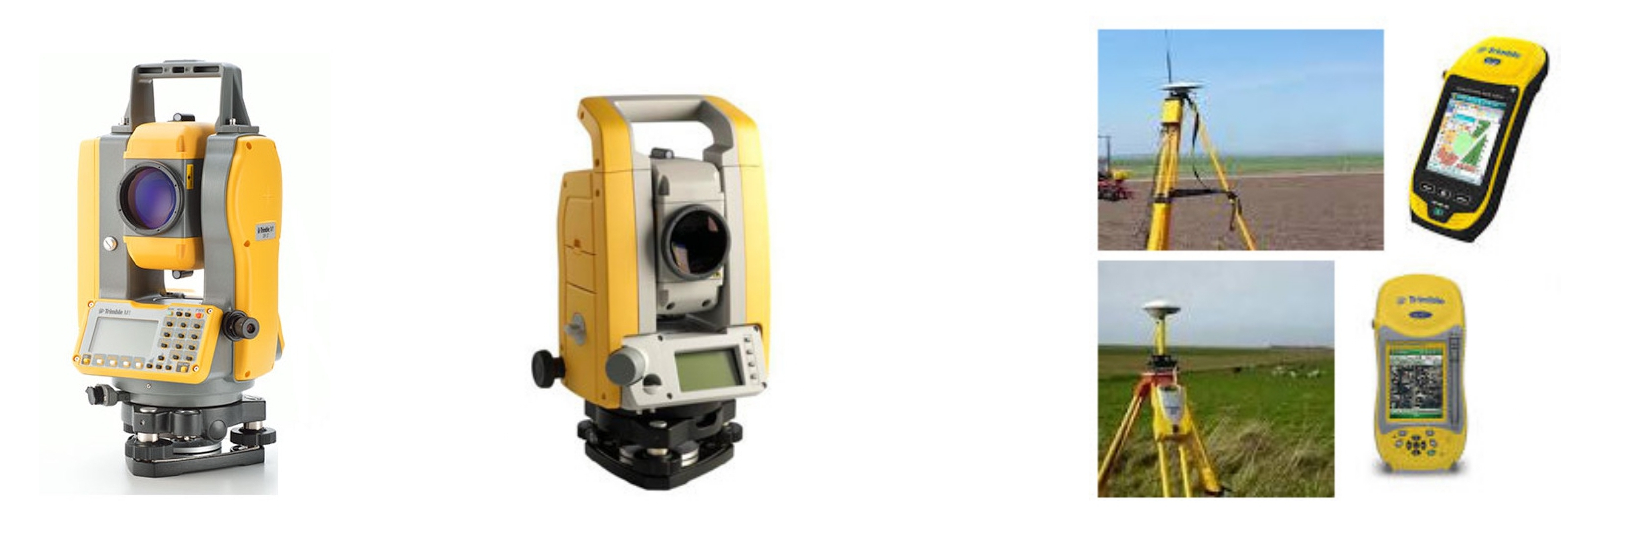
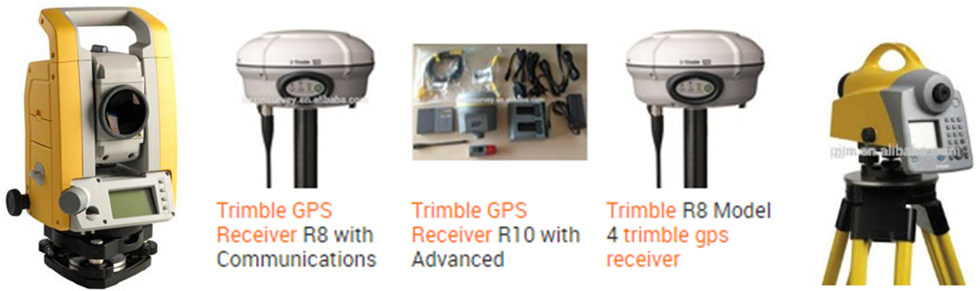
Processing of Total Station Survey Data

HEADS Site software uses Total Station Survey Data for processing Topographical details most effectively and economically in various Construction Projects for Site Leveling and Grading which is the primary job for Land Development. The developed land is used for platforms for the construction of Housing projects, Industrial plant projects, extension of urban Areas, design of roads, parking lots, planning & design of Airports, Tunnel projects, Irrigation projects, Mining projects, Water Distribution System along with Land Record Management etc.
HEADS Site prepares Survey Base Plan or Ground Model from the ground survey data with Total Station. By selecting drawing feature symbols from CAD Block library, the various texts obtained from the surveyors are also placed correctly in the Base Plan drawing. The drawing is made in CAD layered system and is compatible to AutoCAD and other popular CAD softwares.
HEADS Site develops the Digital Terrain Model (DTM) by using the Total Station survey data by Triangulation and subsequently processed for contouring. The area may be identified by site reconnaissance survey and by using Topographic maps along with satellite imageries. The ground elevation data may be either obtained by Total Station Survey or by downloading from SRTM (Shuttle Radar Topography Mission) by using internet. User may procure the computer program Global Mapper to download ground topography data from internet.
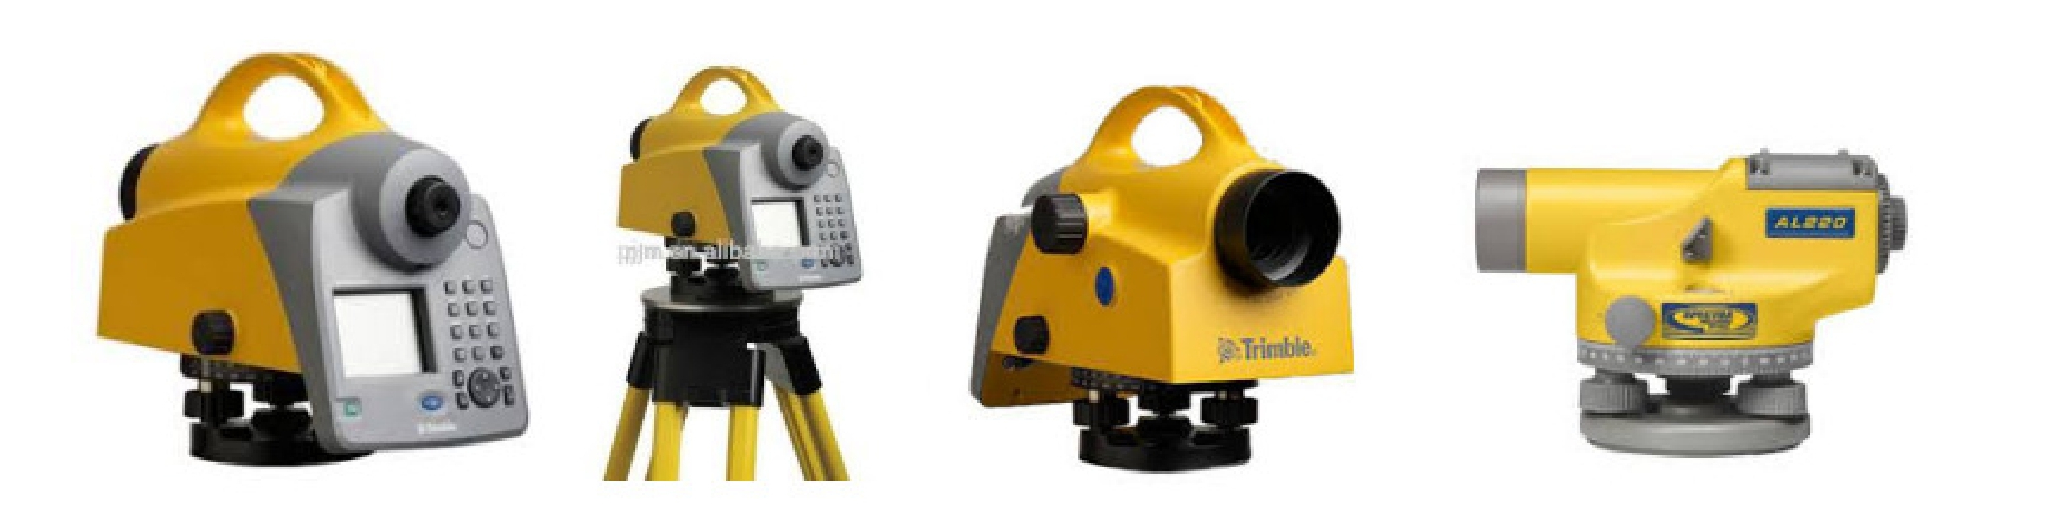
Processing of Autolevel Survey Data
The Autolevel data contains Chainages at a regular / constant interval, the distances on the cross section on either side of the centre point 0.0, left side in ‘-ve’ & right side is ‘+ve’ and the elevations (Z) at all distances on either side of the centre point. The data do not have Easting (X) and Northing (Y) at these points where (Z) is available. So, to get Easting (X) and Northing (Y) at these points an alignment is to be defined, which passes through the centre point at ‘0.0’ of each cross section. Referring to this alignment the program will obtain the X & Y Coordinates of each point on the cross section, this helps in making Triangulation, Digital Terrain Model and finally the Contours of the ground. Only the survey base plan drawing by digital mapping will not be created from ground model, which needs Total Station data for reading various features like Houses, Drains, Electric Poles, Boundary walls etc. on the ground.
Page 6 off 32
Processing of Bearing Line Data
The Bearing Line method of survey is very widely used in the design of hill roads. Every hill road commonly has hill on one side and valley on the other side. In Bearing Line Survey the traverse passes through the foothill side, which changes its side with respect to the road to stick to the hill.
Processing of Robotic Total Station Data

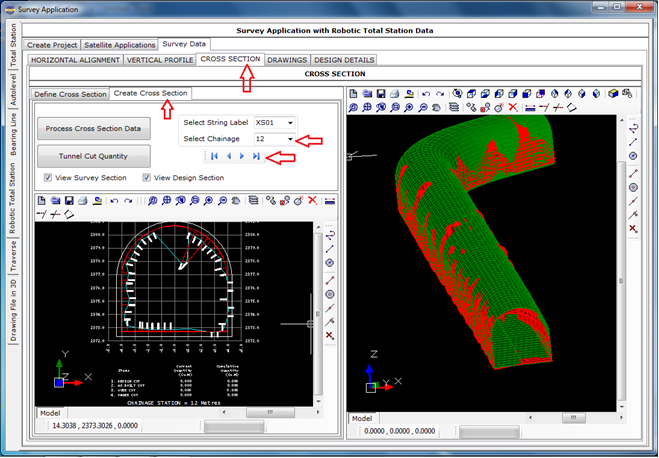
The Robotic Total Station survey data is very widely used in the construction of Bored Tunnels. This is to be noted that the survey is carried out after the boring is done for the tunnel, by following the design horizontal alignment, vertical profile and proposed cross section for the tunnel. The survey data is used to estimate the actual boring against the design cross section of the tunnel. At every chainage the As-Biult and Design Cross Sections are plotted. From the cross sections the ‘Under Cut’ and ‘Over Cut’ quantities are computed by comparing the as-built against the design cross section. Some times in case of excessive overcut the cut quantity is considered up to certain extent outside the design cross section, which is marked as the ‘Pay Line’. Proper measures are to be taken to restore all the over cuts and to remove unwanted soil/rock at the under cuts to match the bored cross sections with the design cross section. All these actions can be done by using the Robotic Total Station survey data and thus processing by HEADS Site to generate cross sections and quantities for Design Cut, As-built Cut (Under Cut & Over Cut) and the Pay Line, also by creating CAD drawings and detail report.
Page 7 off 32
Processing of Traverse Survey Data
HEADS Site generates Traverse Report describing corrected Traverse and its coordinates with closing error corrections by Bowditch, Transit and Closed link, with EDM applications.

The HEADS Site CAD view of drawing with uncorrected and corrected Traverse and its coordinates.

Page 8 off 32
Processing of Drawing File in 3D to extract ground data
The survey plan drawing is made in 3 Dimension and the processing is done to extract the Layer wise x,y,z data of various features of the drawing. The data is saved as Text data in Total Station format and created model with string labels taking from the layer names by saving in the model files.

Ground Modeling
The data in the Total Station survey data file must be made available in the following format and saved as a text file (for example SURVEY.TXT) which can be opened in ‘Notepad’. It has five columns of data, when a data record with Serial No. ‘0’ is met (as after Serial No. 5) then it discontinues the last feature and reads a new feature (from Serial No. 1) in the Ground Model.


Page 9 off 32
Triangulation and Contours
The model Name, String Label and increments for primary, secondary and Text are set with default names & values. If the ground is of flat nature then user has to reduce the primary contour increment as 0.5 or 0.1 to get contours for the relatively flat ground. The secondary contour increment is always five times of increment of the primary contours. Texts for contour elevations are displayed on the secondary contours.

LAND RECORD MANAGEMENT SYSTEM
HEADS Site Relational Data Base Management System (RDBMS by MS Access) is used linked with Land Plan Drawings opening in HEADS CAD Viewer
For any site development project for Township, Industrial Plants, Airports, Housing projects the Acquisition of Land for the site is the next job for preparing for construction. The list of names of the land owners, Land category, Land Plot ID, Plot Number, reference District and State in the country. The owners of the acquired land plots are paid by the project authorities. A proper storage of the details along with land maps are therefore essential for the project. The record details are maintained in Relational Data Base Management Systems (RDBMS) and all the land maps as CAD Drawings. The built-in CAD engine is highly powerful with complete drafting and editing facilities. The drawings are compatible to AutoCAD and all other popular CAD softwares.

Page 10 off 32
Land records may be Entered and stored in MS Access Database format and CAD Drawings
For any Site preparation the land records and land maps in the existing ground are most essential and properly coordinated by HEADS Site. The establishment of correlation between the database records and the related drawings are extremely useful facilities for maintaining the land records by the users.

Land records may be retrieved in various specified formats from database or drawings. The relationship between the land map drawings and related records in database management system is highly useful for land record maintenance.

Page 11 off 32
SITE LEVELING AND GRADING
For any site development project for Township, Industrial Plants, Airports, Housing projects the Levelling Grading of the site is the next job for preparing construction platforms at various elevations and maintaining desired slopes in 3 Dimensional perspectives. The estimation of Earthwork in Cut & Fill is computed accurately by software HEADS Site in well formatted Tabular format following Stations defined along the reference Line. Along with the Digital Terrain Model (DTM) it generates Contours, Elevations on Grids, 3D Surface etc. and all as CAD Drawings. The built-in CAD engine is highly powerful with complete drafting and editing facilities. The drawings are compatible to AutoCAD and all other popular CAD softwares.
For any Site preparation by Leveling & Grading, the existing ground is compared with the Proposed Leveled Ground and the Earthwork is estimated in terms of Cut & Fill.

HEADS Site computes Earthwork for cut and fill as the result of grading of the original uneven ground to construct leveled platforms with roads, drains, slopes etc.

Page 12 off 32
SITE PLANNING
A site planning is done for the construction of the project. In recent past the Total Station Survey data was used to record the existing condition and the land use of the site. By using the present advancement of technology in respect of satellite facilities, the various projects are better planned. In HEADS Site the site planning is effectively done with the in-built CAD engine by opening the satellite imagery and enabling the users to make various site planning on the satellite imagery.

By using Global Mapper the ground elevation data by Shuttle Radar Topography Mission (SRTM) may be downloaded from Internet, without any field survey. This ground data is processed in HEADS Site to develop the Digital Terrain Model (DTM) by Delauney Triangulation and the Ground Contours are created. Next, for site levelling and grading the various construction platforms are planned and for each construction platform the horizontal and vertical alignments for the reference axis is designed. Finally cross sections of the platforms are processed to estimate the cut & fill quantities in respect of the existing ground. A well formatted Text Report for quantity estimation and Mass Haul diagram are generated.

Page 13 off 32
IRRIGATION APPLICATIONS
Earth Dam or Dyke Design
When the dam is completed floods are designed to be discharged through the spillway without damaging the dam. The diversion of the river and construction of the dam in the lowest, river bed area of the dam site is always timed to be carried out during the driest time of the year based on available rainfall records, when floods are least likely to occur; in the event that a flood does occur and the partially completed dam wall is overtopped the downstream face of the dam is covered in protective steel mesh which is designed to prevent flood waters that flow over the top of the dam from washing away the rock and soil which form the dam wall.
EMBANKMENT FILL for Dams or Dykes
Earth and Rock Fill Dams have a relatively narrow, impermeable earth or clay core inside the dam but most of the dam is constructed of permeable rock fill which, by itself, would be incapable of retaining water. The impermeable membrane in these dams is the clay core. Most commonly the Dams or Dykes have roads on the top, which are used by the inspection and service vehicles of Irrigation department and also by the public in case of non-availability of alternative roads. So, Horizontal and vertical alignment of the earth dams or dykes are designed in respect of standards for the construction of roads over it, although the alignment must primarily follow the route of the river or canal. The design is done for the proposed dam cross section to be fitted with the horizontal alignment and vertical profile of the dyke axis or dyke centre line. The side slopes of the dam or dyke cross section may be checked of their stability based on the ‘C-ϕ’ values of the soil material, for which the Bishop’s method is commonly used. The process produces construction drawings for Plan, Profile and Cross sections and by computing the earthwork which is estimated in terms of Cut & Fill.
Concrete Gravity Dam Design
The design considers that technically a concrete gravity dam derives its stability from the force of gravity of the materials in the section and hence the name. The gravity dam has sufficient weight so as to withstand the forces and the overturning moment caused by the water impounded in the reservoir behind it. It transfers the loads to the foundations by cantilever action and hence good foundations are pre requisite for the gravity dam. The design is also checked for leakage of water from the reservoir to the downstream side.

Earth Dam / Dyke

Concrete Gravity Dam
Page 14 off 32
The Plan drawing

The Vertical profile drawing

The Cross Section drawing

Page 15 off 32
Analysis for Stability of Slopes
Slope stability analysis is performed to assess the safe design of a human-made or natural slopes (e.g. embankments of dam, dyke, road, cuts, open-pit mining, excavations, landfills etc.) and the equilibrium conditions. Slope stability is the resistance of inclined surface to failure by sliding or collapsing. The main objectives of slope stability analysis are finding endangered areas, investigation of potential failure mechanisms, determination of the slope sensitivity to different triggering mechanisms, designing of optimal slopes with regard to safety, reliability and economics, designing possible remedial measures, e.g. barriers and stabilization.
Successful design of the slope requires geological information and site characteristics, e.g. properties of soil/rock mass, slope geometry, groundwater conditions, alternation of materials by faulting, joint or discontinuity systems, movements and tension in joints, earthquake activity etc. The presence of water has a detrimental effect on slope stability. Water pressure acting in the pore spaces, fractures or other discontinuities in the materials that make up the pit slope will reduce the strength of those materials. Choice of correct analysis technique depends on both site conditions and the potential mode of failure, with careful consideration being given to the varying strengths, weaknesses and limitations inherent in each methodology.


Page 16 off 32
Canal Design

The entire water conveyance system for irrigation, comprising of the main canal, branch canals, major and minor distributaries, field channels and water courses have to be properly designed. The design process comprises of finding out the longitudinal slope of the channels and fixing the cross sections. The channels themselves may be made up of different construction materials. For example, the main and branch canals may be lined and the smaller ones unlined. Even for the unlined canals, there could be some passing through soils which are erodible due to high water velocity, while some others may pass through stiff soils or rock, which may be relatively less prone to erosion. Further, the bank slopes of canals would be different for canals passing through loose or stiff soils or rock.

Page 17 off 32
River & Canal De-Siltation by Dredging
As the siltation is inevitable in rivers and canals, the water depth is reduced over certain period of time. This causes flood in the adjoining areas. So it is essential to maintain the desired depth in the rivers and canals as required for the estimated discharge. The desiltation is most commonly done by dredging of river or canal bed soil to a certain depth. It helps maintain the desired cross section of river or canal for the estimated water flow. This not only prevents flood but also enables navigation by steamers and vessels for transportation purposes.


Before the dredging a cross section survey is carried out along the length of the river or canal to obtain the existing bed levels at certain distances across the width of the river or canal, on either side of the river or canal centre line. This is done either as X,Y,Z by Total station survey or as Chainage, Offset-distances, Z by Autolevel/Digital level survey. The elevations (Z) at regular chainage interval are plotted as Existing Ground Long Section.
The alignment traverse of the river centre line is collected by using Total Station and GPS as the list of the intersection points with easting (X) and northing (Y) of points at all turns and bends along the river or canal centre line and is used to set curves at each intersection point. This enables to define the horizontal alignment of the river or canal centre line. The desired vertical profile of the centre line of the river or canal bed is designed over the plotting of existing ground long section of the river or canal bed centre line.

Page 18 off 32
Finally, the cross section for water flow for river or canal is defined, along with side slopes and proposed desiltation quantity is computed as cut quantity and the deposit at the locations of excessive erosions as fill quantity. The design bed is derived by horizontal alignment, vertical profile and cross section of the river or canal bed centre line. The design drawings for Plan, Profile and Cross Sections of the river or canal along with estimated quantities for Cut & Fill are produced as the output of the process by HEADS Site.

During the dredging the soil removed from the river or canal bed is dumped on the bank as stock piles, which is to be measured at a regular periodic interval and to be compared against the design Cut-Quantity. Once the dredging is completed, then either the material from De-Siltation or brought from out side sources are stacked at site as stockpiles, which are to used for filling in the excessive erosion location. The stock piles are to be measured and compared against the design Fill-Quantity. Once the whole job for Cut & Fill is over, a post work cross section survey of the river or canal bed is to be done to check about the accuracy of the work against the design cross sections chainage wise.
Stock Piles which are formed by Dredging & De-siltation or Boulder Stacks are computed by processing Total Station elevation survey data. Area and Volume of any Irregular Stock Piles can be measured in 3 Dimensional CAD System. It is also possible to produce Long Section and Cross section drawings of the stock piles with the Built-in CAD system. The Total Station Data by collecting the elevations on and around the stock pile of Earth/Silt Dumps at the site may be processed and the Storage quantity calculations may be produced as Tabular Text Report at various intervals of elevations from Top to Bottom of the stock pile storage.
Quantity estimation of Stockpiles of irregular shape is done by measuring the volume. Stockpiles formed by Dredging and De-siltation or Boulder Stacks are computed by processing Total Station elevation survey data. Area and Volume of any Irregular Stockpiles can be measured in 3 Dimensional CAD System. It is also possible to produce Long Section and Cross section drawings of the stockpiles with the Built-in CAD system. The Total Station Data collecting the elevations on and around the stockpile of Earth/Silt Dumps at the site may be processed and the Storage quantity calculations may be produced as Tabular Text Report at various intervals of elevations from Top to Bottom of the stockpile storage.
Page 19 off 32
Water Discharge Quantity by Measuring Water Level

Discharge from the Dam

Discharge from the Barrage
The process is to estimate the stored water quantity by obtaining the elevations of the bed of storage reservoir of irregular shape at the Dam or Barrage. The elevation data may be processed and the Storage quantity calculations may be produced as Tabular Text Report at desired interval of elevations from Top to Bottom of the water in the reservoir.
To ensure define quantum of discharge of water either from a Dam or Barrage the procedure available with HEADS Site is to get the elevations at different levels of the storage basin on the upstream side. The Global Mapper based elevation capturing is most suitable way by using the latest satellite based technology. Next, from the current water level, the quantity of water under storage area is computed height wise in HEADS Site. This enables the user to get the quantum of water in the storage at different elevations which are at lower levels with respect to the current top water surface. In case some definite quantity of water is to be discharged then reduction of elevation of water surface from the current elevation to reach an elevation to give the desired discharge quantity, will be the linear measure for the desired discharge of stored water.
According to the World Commission on Dams, a key difference between a barrage and a dam is that a dam is built for water storage in a reservoir, which raises the level of water significantly. A barrage is built for diverting water, and raises the water level only a few feet, they are generally built on flat terrain across wide, often meandering rivers. In a Dam that forms a reservoir for the storage of water during the annual flood period of the river in order to supplement the natural flow of the river during the low-water period. A Barrage merely raises the river or canal level, when necessary, to the height required for adequate flow into the canals which take off above it. Barrages are usually larger than the headworks of irrigation and navigation canals, with which they are associated.
A Barrage is a type of low-head, diversion Dam which consists of a number of large gates that can be opened or closed to control the amount of water passing through the structure, and thus regulate and stabilize river water elevation upstream for use in irrigation and other systems. The gates are set between flanking piers which are responsible for supporting the water load of the pool created.

Page 20 off 32
WATER DISTRIBUTION PIPE NETWORK ANALYSIS
Pipe Network Analysis
A pipe network is analyzed for the determination of the nodal pressure heads and the link discharges. As the discharges withdrawn from the network vary with time, it results in a continuous change in the nodal pressure heads and the link discharges. The network is analyzed for the worst combination of discharge withdrawals that may result in low-pressure heads in some areas. The network analysis is also carried out to find deficiencies of a network for remedial measures. It is also required to identify pipe links that would be closed in an emergency to meet fire fighting demand in some localities due to limited capacity of the network. The effect of closure of pipelines on account of repair work is also studied by analyzing a network. Thus, network analysis is critical for proper operation and maintenance of a water supply system.
The Pipe details and Nodal details, are displayed in the CAD Window along with animated direction wise water flow

Design Considerations
The design considerations involve topographic features of terrain, economic parameters, and fluid properties. The essential parameters for network sizing are the projection of residential, commercial, and industrial water demand; per capita water consumption; peak flow factors; minimum and maximum pipe sizes; pipe material; and reliability considerations.
Another important design parameter is the selection of an optimal design period of a water distribution system. The water systems are designed for a pre-decided time horizon generally called design period. For a static population, the system can be designed either for a design period equal to the life of the pipes sharing the maximum cost of the system or for the perpetual existence of the water supply system. On the other hand, for a growing population or water demand, it is always economic to design the system in stages and re-strengthen the system after the end of every staging period.
Page 21 off 32
The design period should be based on the useful life of the component sharing maximum cost, pattern of the population growth or increase in water demand, and discount rate. The reliability Considerations are also important for the design of a water distribution system as there is a trade-off between cost of the system and system reliability.
In general, water distribution systems can be divided into four main components: (1) water sources and intake works, (2) treatment works and storage, (3) transmission mains, and (4) distribution network. The common sources for the untreated or raw water are surface water sources such as rivers, lakes, springs, and man-made reservoirs and groundwater sources such as bores and wells. The intake structures and pumping stations are constructed to extract water from these sources. The raw water is transported to the treatment plants for processing through transmission mains and is stored in clear water reservoirs after treatment. The degree of treatment depends upon the raw water quality and finished water quality requirements. Sometimes, groundwater quality is so good that only disinfection is required before supplying to consumers. The clear water reservoir provides a buffer for water demand variation as treatment plants are generally designed for average daily demand.
Water is carried over long distances through transmission mains. If the flow of water in a transmission main is maintained by creating a pressure head by pumping, it is called a pumping main. On the other hand, if the flow in a transmission main is maintained by gravitational potential available on account of elevation difference, it is called a gravity main. There are no intermediate withdrawals in a water transmission main. Similar to transmission mains, the flow in water distribution networks is maintained either by pumping or by gravitational potential. Generally, in a flat terrain, the water pressure in a large water distribution network is maintained by pumping; however, in steep terrain, gravitational potential maintains a pressure head in the water distribution system.
A distribution network delivers water to consumers through service connections. Such a distribution network may have different configurations depending upon the layout of the area. Generally, water distribution networks have a looped (as available in HEADS Site) and branched configuration of pipelines, but sometimes either looped or branched configurations are also provided depending upon the general layout plan of the city roads and streets. Urban water networks have mostly looped configurations, whereas rural water networks have branched configurations. On account of the high-reliability requirement of water services, looped configurations are preferred over branched configurations.
The cost of a water distribution network depends upon proper selection of the geometry of the network. The selection of street layout adopted in the planning of a city is important to provide a minimum-cost water supply system. The two most common water supply configurations of looped water supply systems are the gridiron pattern and the ring and radial pattern; however, it is not possible to find an optimal geometric pattern that minimizes the cost.
Pipe Network Analysis
A pipe network is analyzed for the determination of the nodal pressure heads and the link discharges. As the discharges withdrawn from the network vary with time, it results in a continuous change in the nodal pressure heads and the link discharges. The network is analyzed for the worst combination of discharge withdrawals that may result in low-pressure heads in some areas. The network analysis is also carried out to find deficiencies of a network for remedial measures. It is also required to identify pipe links that would be closed in an emergency to meet fire fighting demand in some localities due to limited capacity of the network. The effect of closure of pipelines on account of repair work should also be studied by analyzing a network. Thus, network analysis is critical for proper operation and maintenance of a water supply system.
Flow Hydraulics And Network Analysis
The flow hydraulics covers the basic principles of flow such as continuity equation, equations of motion, and Bernoulli’s equation for close conduit. Another important area of pipe flows is to understand and calculate resistance losses and form losses due to pipe fittings (i.e., bends, elbows, valves, enlargers and reducers), which are the essential parts of a pipe network. Suitable equations for form-losses calculations are required for total head-loss computation as fittings can contribute significant head loss to the system.
The flow hydraulics of fluid transporting sediments in suspension and of capsule transport through a pipeline is complex in nature and needs specific consideration in head-loss computation. Such an area of fluid flow is of
Page 22 off 32
special interest to industrial engineers/designers engaged in such fluid transportation projects. The basics of sediment and capsule transport through pipes are important for computation of flow through pipes.
Analysis of a pipe network is essential to understand or evaluate a physical system, thus making it an integral part of the synthesis process of a network. In case of a single input system, the input discharge is equal to the sum of withdrawals (As available in module DisNet). The known parameters in a system are the pipe sizes and the nodal withdrawals. The system has to be analyzed to obtain input point discharges, pipe discharges, and nodal pressure heads. In case of a branched system, starting from a dead-end node and successively applying the node flow continuity relationship, all pipe discharges can be easily estimated. Once the pipe discharges are known, the nodal pressure heads can be calculated by applying the pipe head-loss relationship starting from an input source node with known input head. In a looped network, the pipe discharges are derived using loop head-loss relationship for known pipe sizes and nodal continuity equations for known nodal withdrawals.
Darcy–Weisbach and Hazen–Williams provided the equations for the head loss computation through pipes. Liou (1998) pointed out the limitations of the Hazen–Williams equation, and in conclusion he strongly discouraged the use of the Hazen–Williams equation. He also recommended the use of the Darcy–Weisbach equation with the Colebrook–White equation. The Hazen–Williams equation was not only inaccurate but also was conceptually incorrect. Brown (2002) examined the historical development of the Darcy–Weisbach equation for pipe flow resistance and stated that the most notable advance in the application of this equation was the publication of an explicit equation for friction factor. He concluded that due to the general accuracy and complete range of application, the Darcy–Weisbach equation should be considered the standard and the others should be left for the historians. Considering the above investigations, only the Darcy–Weisbach equation for pipe flow has been identified as acceptable for pipe network analysis.
Based on the application of an analysis method for water distribution system analysis, the information about pipes forming primary loops can be an essential part of the data. The loop data do not constitute information independent of the link-node information, and theoretically it is possible to generate loop data from this information. The information about the loop-forming pipes can be developed by combining flow paths. These pipe flow paths, which are the set of pipes connecting a demand (withdrawals) node to the supply (input) node, can be identified by moving opposite to the direction of flow in pipes. Unlike branched systems, the flow directions in looped networks are not unique and depend upon a number of factors, mainly topography, nodal demand, layout, and location and number of input (supply) points. The pipe flow patterns will vary based on these factors. Hence, combining flow paths, the flow pattern map of a water distribution network can also be generated, which is important information for an operator/manager of a water system for its efficient operation and maintenance.
The analysis of a network is also important to make decisions about the network augmentation requirements due to increase in water demand or expansion of a water servicing area. The understanding of pipe network flows and pressures is important for making such decisions for a water supply system.
Generally, the water service connections (withdrawals) are made at an arbitrary spacing from a pipeline of a water supply network. Such a network is difficult to analyze until simplified assumptions are made regarding the withdrawal spacing. The current practice is to lump the withdrawals at the nodal points; however, a distributed approach for withdrawals should also be considered. A methodology is required to calculate flow and head losses in the pipeline due to lumped and distributed withdrawals.
Hardy Cross Method
Analysis of a pipe network is essential to understand or evaluate a pipe network system. In a branched pipe network, the pipe discharges are unique and can be obtained simply by applying discharge continuity equations at all the nodes. However, in case of a looped pipe network, the number of pipes is too large to find the pipe discharges by merely applying discharge continuity equations at nodes. The analysis of looped network is carried out by using additional equations found from the fact that while traversing along a loop, as one reaches at the starting node, the net head loss is zero. Here, the analysis of looped network is involved, as the loop equations are nonlinear in discharge.
Page 23 off 32
STREAM HYDROLOGY for WATERWAY ADEQUACY
Stream Hydrology is computed in details from Terrain Topography by transforming Transverse marcator data to Universal Tranverse marcator (UTM) data, Referring to WGS84 origin and directly downloaded from Shuttle Radar Topography Mission (SRTM) without Topo maps. Discharge Location at Bridge is measured from farthest point of the River for water discharge at the Bridge location. The environment is 3D CAD, fully compatible to other CAD softwares.

Synthetic Unit Hydrograph (SUH) is plotted by comparing sum of discharge for 1 hour interval of Time and volume of 1 cm direct Runoff.

Page 24 off 32
MINING APPLICATIONS
Mining applications involves Survey Applications for Traversing with closing error corrections, Ground Model, Digital Terrain Model (DTM), Contour, Land Acquisition with Land Record Management System and Slope Stability Analysis as general applications available with HEADS Site. Additional special applications for Mining are for the measurements of excavation quantity in Open Cast Mines and measurement of Stockpile Quantity. Use of satellite data from Shuttle Radar Topography Mission (SRTM) downloaded with Global Mapper and thus processing the data by HEADS Site for quantity measurements effectively uses the advanced technology.
Measurement of Excavation Quantity in Open Cast Mines
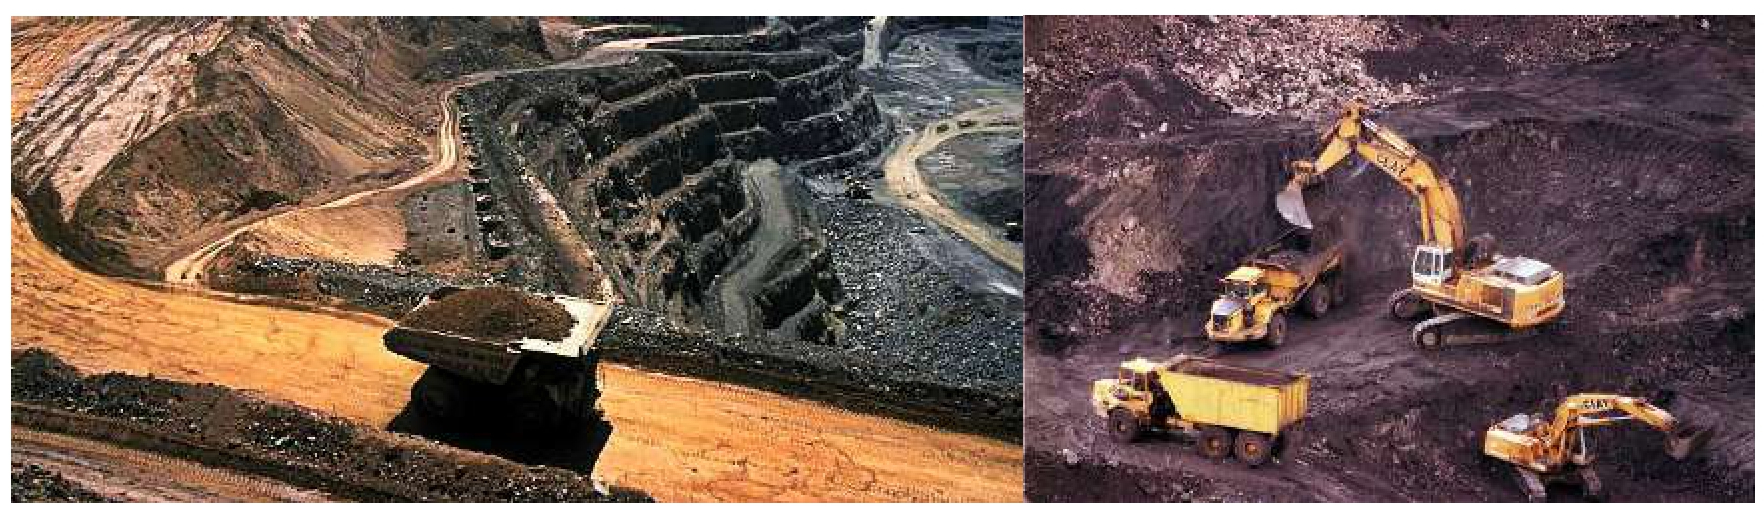
The two main methods which are used for coal extraction are surface mining and underground mining. The methods used to extract coal depend on the geology of the coal. Open cast mining is usually called open-pit or open-cut mining. According to the Berkeley Laboratory for Automation Science and Engineering, open cast mines are designed before a mining operation begins. Engineers divide the area to be mined into large cubes, which are excavated one at a time until the entire mining project is completed. The blocks are mined in a predetermined order to maximize profits and minimize environmental impacts.
Measurement of Stockpile Quantity
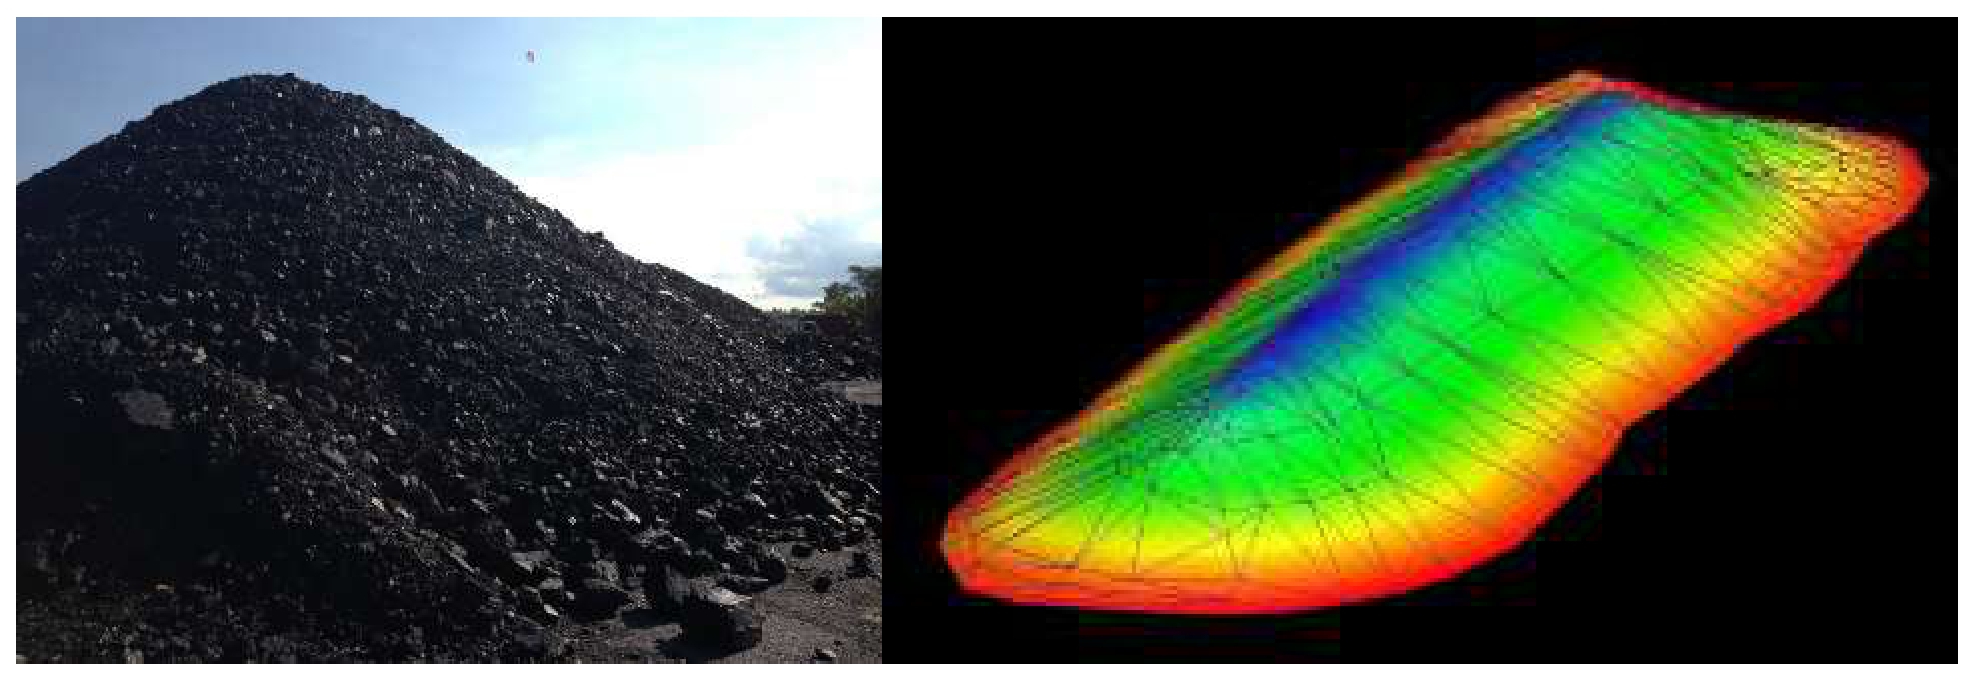
The area of horizontal plane is computed at top most elevation, and there is no quantity is estimated at this top most elevation. Next, the area is computed for the horizontal plane at next lower elevation, and the quantity is estimated as the average of the previous and the current areas and by multiplying by their difference of elevations. Every time the current volume and the cumulative volume are computed and written in the report.
This process is continued up to the lowest elevation of the Open Cast Pit, at this lowest point the cumulative volume gives the volume for the excavated pit under consideration. The report is also opened in ‘Notepad’ this helps in taking printout of the report. The difference between two volumes made by obtaining survey data (or satellite downloaded data) at certain interval of time gives the current volume of excavation during that period.
Page 25 off 32
ROAD PROJECTS
Design of Road or Highway

The design of road/highway with selected cross section for single or dual carriageway, with or without service roads, is applied from start to end of the alignment. The design is based on the alignment and profile of the center line of the road cross section.
The most appropriate location, alignment, and shape of a highway are selected during the design stage. Highway design involves the consideration of three major factors (human, vehicular, and roadway) and how these factors interact to provide a safe highway. Human factors include reaction time for braking and steering, visual acuity for traffic signs and signals, and car-following behavior. Vehicle considerations include vehicle size and dynamics that are essential for determining lane width and maximum slopes, and for the selection of design vehicles. Highway engineers design road geometry to ensure stability of vehicles when negotiating curves and grades and to provide adequate sight distances for undertaking passing maneuvers along curves on two-lane, two-way roads.
HEADS Site considers that the highway and transportation engineers must meet many safety, service, and performance standards when designing highways for certain site topography. Highway geometric design primarily refers to the visible elements of the highways. Highway engineers who design the geometry of highways must also consider environmental and social effects of the design on the surrounding infrastructure.
Road design is done with certain considerations that must be properly addressed in the design process to successfully fit a highway to a site's topography and maintain its safety. Some of these design considerations include:
The operational performance of a highway can be seen through drivers’ reactions to the design considerations and their interaction.
Page 26 off 32
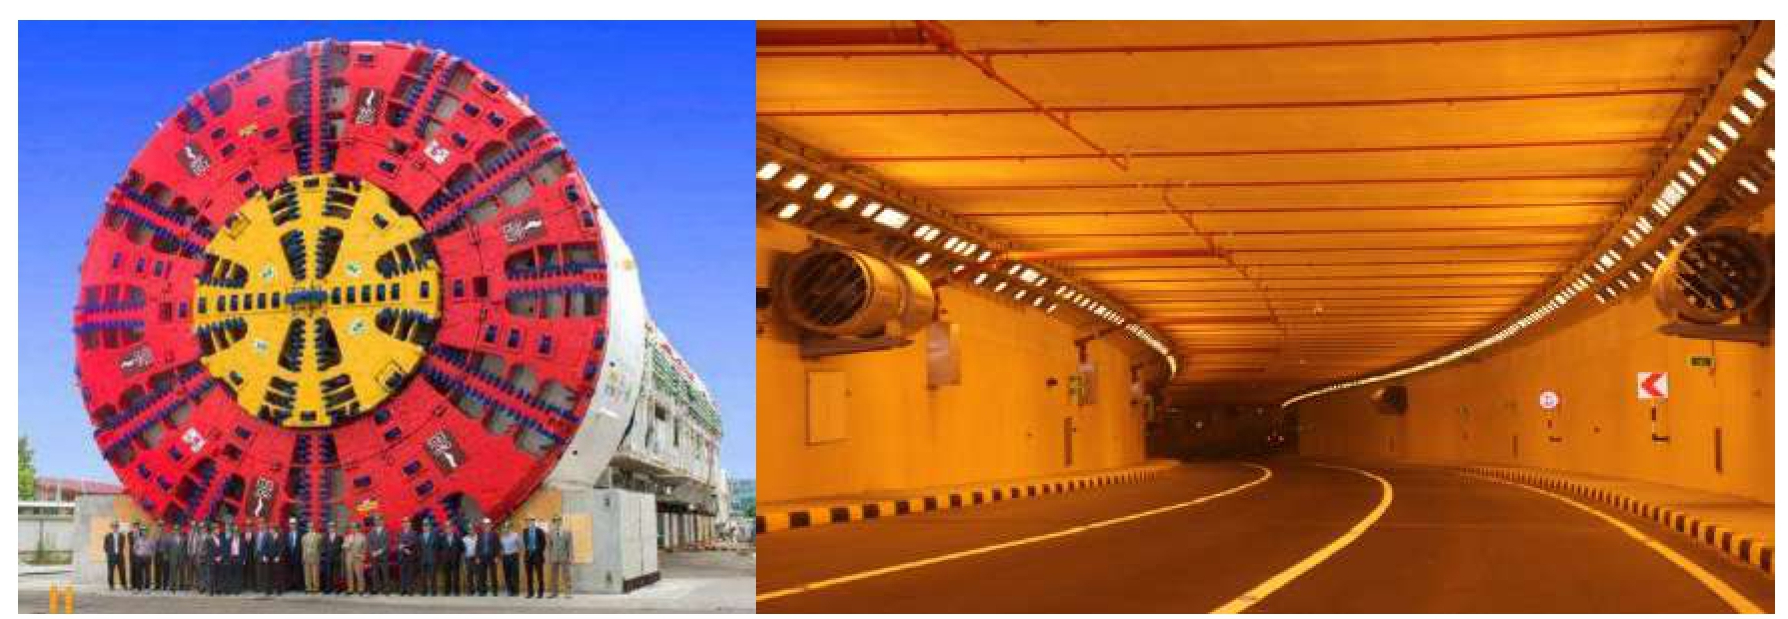
TUNNEL PROJECTS
Tunnels are constructed to create travel routes without disturbing the existing roads & structures on the surface and environment, ensure uninterrupted traffic flow, shorter travel distance and shorter travel time. Tunnels are mainly of two categories Cut & Cover and Bored Tunnels.

Bored Tunnels are commonly constructed for highway or railway or hydel power projects. These are underground structures, here the construction depends of accurate monitoring, which is done by Robotic Total Stations which automatically records scanned data as soon as some segment is constructed. HEADS Site processes the scanned data to create CAD drawings and related report to describe section wise design cut, Over cut, Under cut to monitor the construction with best possible accuracy.
Inside metro tunnels the rail coaches are tilted at curved sections, here HEADS Site generates complete set of CAD drawings for coach profiles at desired interval, at curves. This enables the users to check the lateral clearance available between the tilted coaches and the side walls of the tunnel.
Page 27 off 32

The Geometric design of Tunnel features for Horizontal Alignment, Vertical Profile and Customized Cross Sections by using Scan Survey Data by Robot Total Station along with Estimation of Excavated Quantities for Design cross sections, As-built cross sections in respect of Pay-cut and studies on Coach profile.
The Structural design of Tunnel by our software ASTRA Pro is based on RMR Increments for Rock Bolting, Shotcrete, Steel Ribs, Wire Mesh, RCC Lining and Tunnel Portals.
Page 28 off 32
CAD based design for Horse Shoe/Semi Circular/Circular/Rectangular/Custom type Tunnel Sections

The Boring Cut Quantities are estimated for Design Cut, As Built Cut, Over Cut and Under Cut. The “Pay Line” outside the design section is also defined to include the desired amount of overcut in the measurements. Ready to Plot and Editable CAD Drawings are created as the output.

Page 29 off 32
AIRPORT PROJECT
Features for Layout Plan, Design of Runway, Taxiway, Apron, Tarmac, Rapid Exits
Below is the sample drawing for Airport Master Plan Layout and is to be prepared and finalized before the detail engineering design for a new airport project or for the extension of an existing airport project. The build of NSCB International Airport at Kolkata, India was successfully designed with complete set of ‘Good for Construction drawings’.

Pavement Design
Analysis of layered Pavement System
HEADS Site features for ‘Pavement Design’ with Flexible, Rigid, Overlay, Layered Pavement System and Bituminous Mix design. In Layered System of analysis the total number of layers may be 4 or 3 or 2. Top most layer is combined for all Bound Layers (Asphalt/Bituminous Concrete, DBM, BM etc.), next lower layer is for all Unbound Layers combined for Base Course (WMM) and Granular Sub base layer (GSB) or separately for WMM or GSB, next and lowest layer is always the Subgrade Layer. For each layer thickness, Elastic Modulus, Poisson’s Ratio are to be given. For Subgrade no thickness is to be given. The wheel load and tire pressure are given in kN and N/Sq.mm (Mpa) respectively.

Page 30 off 32
Airport Planning
Aircraft Data
Every Airport planning is done by considering the design aircraft which has largest requirements for provisions for its operating for ground maneuvers compared to other aircrafts proposed to use the Airport. To plan for an Airport the design engineers need to have the essential details for the design aircraft. Airport Planning has various “Aircraft data”, The details may be obtained either from drawing or from Excel Worksheet for the selected aircraft.

Runway Orientation by Windrose Diagram
Next, select the Tab “Runway Orientation”, Click on the buttons “Display Wind Data”, this will display the “Windrose” diagram by plotting total percentages of wind speeds in scale in different directions, next, click on button “Runway Strip”, to put the representative rectangle on the Windrose diagram. There are controls to rotate the Runway Strip and to finalize the orientation by considering the wind speed and then obstructions like high rise structures, mountains etc. The drawing may be saved either as DWG or DXF for all future references.

Page 31 off 32

(An ISO 9001:2015 Company)
Mobile/Whatsapp: +91 9331 9330 39
Tel: +91 33 4008 3349, +91 33 4603 6129
Website: www.techsoftglobal.com
Email: techsoftinfra@gmail.com, techsoft@consultant.com
HEADS Site - Premium version contains all the above modules such as, Survey, Irrigation, Mining, Infrastructure and Tunnel Applications
The module contains the following items:
Page 32 off 32
 Previous